4. json API
API stands for Application Programming Interface.
The API defines how two applications communicate with each other using requests and responses.
urllib tutorial See: https://realpython.com/urllib-request/
Free weather API See: https://open-meteo.com/
4.1. Getting free weather data from the web
The free API provides weather data. See: https://open-meteo.com/
Use the form at: https://open-meteo.com/en/docs#api_form
Enter Melbourne as the city and use the daily checkboxes to generate the url below.
The url below is for Melbourne daily max and min temperatures for the next 7 days.
The built-in python library, urllib, is used to get the web data from the url.
The syntax for urlopen and read is below.
from urllib.request import urlopen

url = "https://api.open-meteo.com/v1/forecast?latitude=-37.81&longitude=144.96&daily=temperature_2m_max,temperature_2m_min&timezone=Australia%2FSydney"
with urlopen(url) as response:
    source = response.read()
print(source)
The data returned from the url above is for “2023-01-17” to “2023-01-23”.
The response is a byte string indicated by “b’”.
b'{"latitude":-37.75,"longitude":145.0,"generationtime_ms":0.2799034118652344,"utc_offset_seconds":39600,"timezone":"Australia/Sydney","timezone_Abbriation":"AEDT","elevation":98.0,"daily_units":{"time":"iso8601","temperature_2m_max":"\xc2\xb0C","temperature_2m_min":"\xc2\xb0C"},"daily":{"time":["2023-01-17","2023-01-18","2023-01-19","2023-01-20","2023-01-21","2023-01-22","2023-01-23"],"temperature_2m_max":[36.6,26.4,19.0,22.9,26.4,28.0,27.2],"temperature_2m_min":[19.0,14.6,13.3,12.8,14.1,16.1,17.0]}}'
4.2. urlopen function
The full syntax is at: https://docs.python.org/3/library/urllib.request.html#urllib.request.urlopen
The most used syntax is:
- urlopen(url)
- Parameters:
url – a URL, which is a string
Returns a http.client.HTTPResponse object.
4.3. read function
The syntax is:
- HTTPResponse.read([amt])
- Parameters:
amt – the number of bytes to read. Omit by default so that the whole body is returned.
Reads and returns the response body
4.4. Reading weather json
The code below takes the source and loads it into a json object, data.
Then the data is dumped to view the keys so that the dates and temperatures can be indexed.
import json
from urllib.request import urlopen

url = "https://api.open-meteo.com/v1/forecast?latitude=-37.81&longitude=144.96&daily=temperature_2m_max,temperature_2m_min&timezone=Australia%2FSydney"
with urlopen(url) as response:
    source = response.read()
data = json.loads(source)
print(json.dumps(data, indent=4))
Snippets of the json dump are below to help identify the keys for the weather data.
{
    "latitude": -37.75,
    "longitude": 145.0,
    ...
    },
    "daily": {
        "time": [
            "2023-01-17",
            ...
            "2023-01-23"
        ],
        "temperature_2m_max": [
            36.7,
            ...
            28.6
        ],
        "temperature_2m_min": [
            19.0,
            ...
            16.7
        ]
    }
}
The keys needed are:
data[“daily”][“time”]
data[“daily”][“temperature_2m_max”]
data[“daily”][“temperature_2m_min”]
Each of these keys returns a list of 7 values, of which 2 are shown in the snippets above.
The code below uses the keys identifies above to place the weather data lists in 3 variables: dates_list, max_list, min_list.
The 3 lists hold their data in sequence. The first values in each list are for the same date.
The zip function is used on the 3 lists so that they can be iterated over together.
The weather data is printed out below.
import json
from urllib.request import urlopen

url = "https://api.open-meteo.com/v1/forecast?latitude=-37.81&longitude=144.96&daily=temperature_2m_max,temperature_2m_min&timezone=Australia%2FSydney"
with urlopen(url) as response:
    source = response.read()
data = json.loads(source)
dates_list = data["daily"]["time"]
max_list = data["daily"]["temperature_2m_max"]
min_list = data["daily"]["temperature_2m_min"]

for day, min, max in zip(dates_list, min_list, max_list):
    print(day, min, max)
2023-01-17 19.0 36.7
2023-01-18 14.6 24.7
2023-01-19 13.5 19.0
2023-01-20 13.0 22.3
2023-01-21 14.4 26.7
2023-01-22 15.9 26.7
2023-01-23 16.7 28.6
To add headings to the printed data the following code is used.
Padding has to be added to align the headings to the data.
The string lenths for each header are in the paddings list.
A list comprehension,
padded_header = [h.ljust(p) for h, p in zip(header,paddings)], is used to build the list of padded strings.header = ["day", "min", "max"]
paddings = [11, 5, 5]
padded_header = [h.ljust(p) for h, p in zip(header,paddings)]
for head_str in padded_header:
print(head_str, end='')
print()
The full code is below
import json
from urllib.request import urlopen
url = "https://api.open-meteo.com/v1/forecast?latitude=-37.81&longitude=144.96&daily=temperature_2m_max,temperature_2m_min&timezone=Australia%2FSydney"
with urlopen(url) as response:
source = response.read()
data = json.loads(source)
dates_list = data["daily"]["time"]
max_list = data["daily"]["temperature_2m_max"]
min_list = data["daily"]["temperature_2m_min"]
header = ["day", "min", "max"]
paddings = [11, 5, 5]
padded_header = [h.ljust(p) for h, p in zip(header,paddings)]
for head_str in padded_header:
    print(head_str, end='')
print()
for day, min, max in zip(dates_list, min_list, max_list):
print(day, min, max)
day        min  max
2023-01-17 19.0 36.7
2023-01-18 14.6 24.7
2023-01-19 13.5 19.0
2023-01-20 13.0 22.3
2023-01-21 14.4 26.7
2023-01-22 15.9 26.7
2023-01-23 16.7 28.6
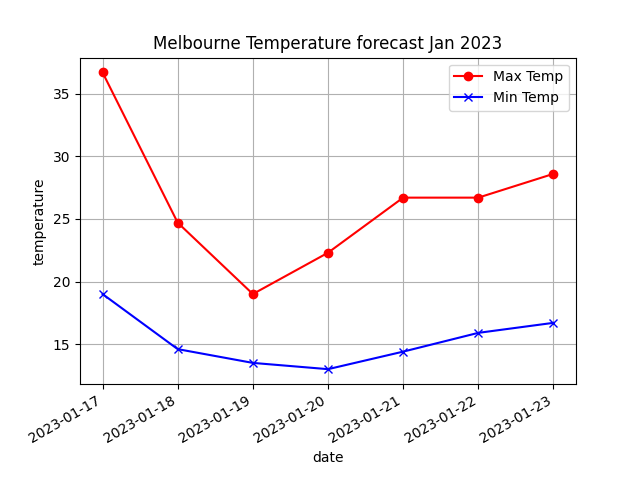
4.5. Plot weather data
As an extension, the weather data is plotted below.
import json
from urllib.request import urlopen
import matplotlib.pyplot as plt

url = "https://api.open-meteo.com/v1/forecast?latitude=-37.81&longitude=144.96&daily=temperature_2m_max,temperature_2m_min&timezone=Australia%2FSydney"
with urlopen(url) as response:
    source = response.read()
data = json.loads(source)
dates_list = data["daily"]["time"]
max_list = data["daily"]["temperature_2m_max"]
min_list = data["daily"]["temperature_2m_min"]

xAxis = dates_list
tmax = max_list
tmin = min_list
plt.grid(True)
plt.xlabel('date')
plt.ylabel('temperature')
plt.title('Melbourne Temperature forecast Jan 2023')

## LINE GRAPH ##
plt.plot(xAxis, tmax, color='red', marker='o', label = "Max Temp")
plt.plot(xAxis, tmin, color='blue', marker='x', label = "Min Temp")

# format dates so they are angled to fit
plt.gcf().autofmt_xdate()
plt.legend()
plt.show()